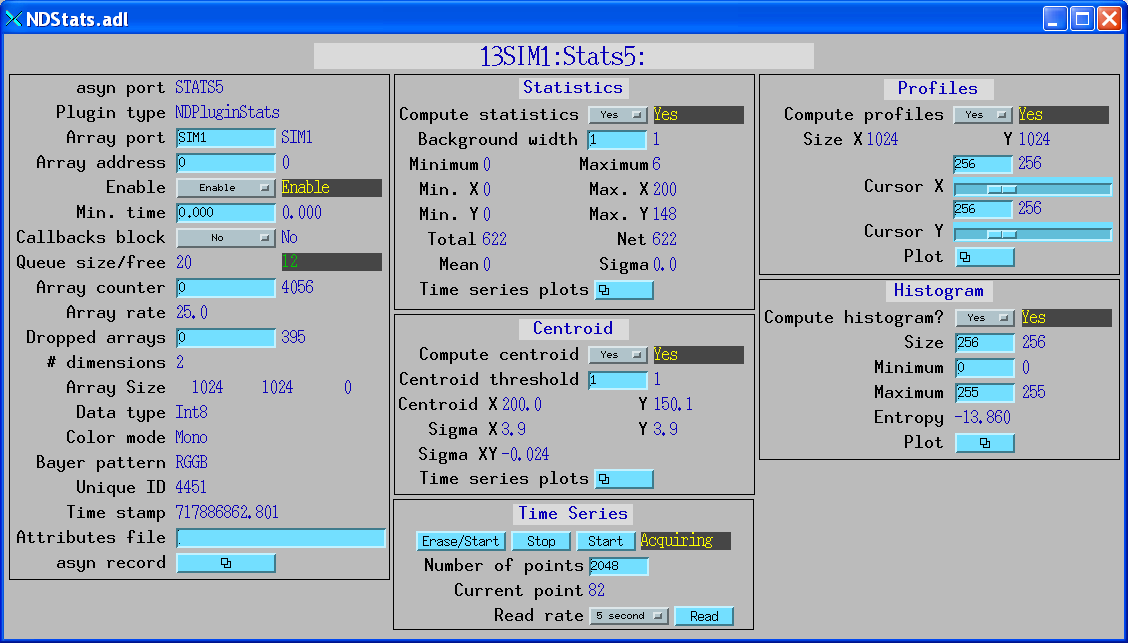
NDStats.adl
NDPluginStats computes the following.
Each calculcation can independently enabled and disabled. Calculations 1 and 4 can be perfomed on arrays of any dimension. Calculations 2 and 3 are restricted to 2-D arrays.
Time-series arrays of the basic statistics, centroid and sigma statistics can also be collected. This is very useful for on-the-fly data acquisition, where the NDStats plugin computes the net or total counts in the detector or an ROI. It can also be used to quickly plot a time-history of beam position or width, etc.
NDPluginStats inherits from NDPluginDriver. The NDPluginStats class documentation describes this class in detail.
NDPluginStats.h defines the following parameters. It also implements all of the
standard plugin parameters from NDPluginDriver.
The EPICS database NDStats.template provide access to these parameters, listed in
the following table. Note that to reduce the width of this table the parameter index
variable names have been split into 2 lines, but these are just a single name, for
example NDPluginStatsComputeStatistics.
| Parameter Definitions in NDPluginStats.h and EPICS Record Definitions in NDStats.template | ||||||
| Parameter index variable | asyn interface | Access | Description | drvInfo string | EPICS record name | EPICS record type |
|---|---|---|---|---|---|---|
| Basic statistics | ||||||
|
NDPluginStats ComputeStatistics |
asynInt32 | r/w | Flag to control whether to compute statistics for this array (0=No, 1=Yes). Not computing statistics reduces CPU load. Basic statistics computations are quite fast, since they involve mostly double precision addition, with 1 multiply to compute sigma, per array element. | COMPUTE_STATISTICS |
$(P)$(R)ComputeStatistics $(P)$(R)ComputeStatistics_RBV |
bo bi |
|
NDPluginStats BgdWidth |
asynInt32 | r/w | Width of the background in pixels to use when computing net counts. 0=no background subtraction, so the net counts is the same as the total counts. | BGD_WIDTH |
$(P)$(R)BgdWidth $(P)$(R)BgdWidth_RBV |
longout longin |
|
NDPluginStats MinValue |
asynFloat64 | r/o | Minimum value in any element in the array | MIN_VALUE | $(P)$(R)MinValue_RBV | ai |
|
NDPluginStats MinX |
asynFloat64 | r/o | X pixel location of minimum value in the array. This is only valid for 2-D monochromatic arrays. | MIN_X | $(P)$(R)MinX_RBV | ai |
|
NDPluginStats MinY |
asynFloat64 | r/o | Y pixel location of minimum value in the array. This is only valid for 2-D monochromatic arrays. | MIN_Y | $(P)$(R)MinY_RBV | ai |
|
NDPluginStats MaxValue |
asynFloat64 | r/o | Maximum value in any element in the array | MAX_VALUE | $(P)$(R)MaxValue_RBV | ai |
|
NDPluginStats MaxX |
asynFloat64 | r/o | X pixel location of maximum value in the array. This is only valid for 2-D monochromatic arrays. | MAX_X | $(P)$(R)MaxX_RBV | ai |
|
NDPluginStats MaxY |
asynFloat64 | r/o | Y pixel location of maximum value in the array. This is only valid for 2-D monochromatic arrays. | MAX_Y | $(P)$(R)MaxY_RBV | ai |
|
NDPluginStats MeanValue |
asynFloat64 | r/o | Mean value in the array | MEAN_VALUE | $(P)$(R)MeanValue_RBV | ai |
|
NDPluginStats Total |
asynFloat64 | r/o | Sum (total) of all elements in the array. This is available as an ai record. The total counts are also available as epicsInt32 values in an mca record via callbacks to the drvFastSweep driver. The mca record is very useful for on-the-fly data acquisition of the total counts in the detector or in an ROI. | TOTAL |
$(P)$(R)Total_RBV $(P)$(R)TotalArray |
ai mca |
|
NDPluginStats Net |
asynFloat64 | r/o | Net (background subtracted) total of all elements in the array. The background is calculated by determining the average counts per array element in a border around the array of width NDPluginStatsBgdWidth. This average background counts per element is then subtracted from all elements inside the array. If NDPluginStatsBgdWidth is ≤ 0 then no background is computed. The net counts is available as an ai record. The net counts is also available as epicsInt32 values in an mca record via callbacks to the drvFastSweep driver. The mca record is very useful for on-the-fly data acquisition of the net counts in the detector or in an ROI. | NET |
$(P)$(R)Net_RBV $(P)$(R)NetArray |
ai mca |
|
NDPluginStats SigmaValue |
asynFloat64 | r/o | Sigma (standard deviation) of all elements in the array | SIGMA_VALUE | $(P)$(R)Sigma_RBV | ai |
| Centroid statistics | ||||||
|
NDPluginStats ComputeCentroid |
asynInt32 | r/w | Flag to control whether to compute the centroid statistics (0=No, 1=Yes). The centroids are computed from the average row and column profiles above the centroid threshold. These calculations are also quite fast, since they just involve addition operations for each array element. | COMPUTE_CENTROID |
$(P)$(R)ComputeCentroid $(P)$(R)ComputeCentroid_RBV |
bo bi |
|
NDPluginStats CentroidThreshold |
asynFloat64 | r/w | Threshold used when computing the centroid statistics. All array elements less than this value are set to 0 for computing the centroid statistics. It is important to set this value to ignore the "background" when computing the position and size of a "beam" image, for example. | CENTROID_THRESHOLD |
$(P)$(R)CentroidThreshold $(P)$(R)CentroidThreshold_RBV |
ao ai |
|
NDPluginStats CentroidX |
asynFloat64 | r/o | X centroid of the array above the centroid threshold. | CENTROIDX_VALUE | $(P)$(R)CentroidX_RBV | ai |
|
NDPluginStats CentroidY |
asynFloat64 | r/o | Y centroid of the array above the centroid threshold. | CENTROIDY_VALUE | $(P)$(R)CentroidY_RBV | ai |
|
NDPluginStats SigmaX |
asynFloat64 | r/o | Sigma X (width) of the distribution above the centroid threshold. | SIGMAX_VALUE | $(P)$(R)SigmaX_RBV | ai |
|
NDPluginStats SigmaY |
asynFloat64 | r/o | Sigma Y (height) of the distribution above the centroid threshold. | SIGMAY_VALUE | $(P)$(R)SigmaY_RBV | ai |
|
NDPluginStats SigmaXY |
asynFloat64 | r/o | This is the normalized value of sigmaXY, i.e. sigmaXY/(sigmaX * sigmaY). This is often called the correlation coefficient, r. It is zero if the X and Y profiles are not correlated, meaning that the distribution is not tilted with respect to the X and Y axes. | SIGMAXY_VALUE | $(P)$(R)SigmaXY_RBV | ai |
| Time-Series data | ||||||
|
NDPluginStats TSControl |
asynInt32 | r/w |
Controls time-series data collection. The enum choices are:
|
TS_CONTROL | $(P)$(R)TSControl | mbbo |
| N.A. | N.A. | r/w | Sends the "Read" command to the TSControl record above. This record can be periodically processed to update the time-series waveform records. It is scan disabled if TSAcquiring=Done, so that updates are only performed when time-series acquisition is in progress. | N.A. | $(P)$(R)TSRead | longout |
|
NDPluginStats TSNumPoints |
asynInt32 | r/w | Controls the number of time-series points to collect. There is no maximum value, the time-series arrays in the plugin are freed and reallocated each time this value is changed. However, the size of the waveform records is fixed when the IOC is started, so NELM in those records must be large enough for the largest time-series needed. | TS_NUM_POINTS | $(P)$(R)TSNumPoints | longout |
|
NDPluginStats TSCurrentPoint |
asynInt32 | r/o | The current time-series point. If TSCurrentPoint reaches TSNumPoints then time-series acquisition is automatically stopped, and callbacks are done on all time-series waveform records, updating the values. This means that even if TSRead has SCAN=Passive that the waveform records will update when time-series acquisition is complete. | TS_CURRENT_POINT | $(P)$(R)TSCurrentPoint | longin |
|
NDPluginStats TSAcquiring |
asynInt32 | r/o | Indicates status of time-series data acquisition. Values are 0=Done and 1=Acquiring. | TS_ACQUIRING | $(P)$(R)TSAcquiring | bi |
|
NDPluginStats TSXXX |
asynFloat64Array | r/o |
The time series data arrays. XXX is one of the following, corresponding to each
of the basic statistics and centroid and sigma statistics described above:
|
|
$(P)$(R)TSXXX | waveform |
| X and Y Profiles | ||||||
|
NDPluginStats ComputeProfiles |
asynInt32 | r/w | Flag to control whether to compute the profiles for this array (0=No, 1=Yes). | COMPUTE_PROFILES |
$(P)$(R)ComputeProfiles $(P)$(R)ComputeProfiles_RBV |
bo bi |
|
NDPluginStats ProfileSizeX |
asynInt32 | r/w | Number of array elements in the X profiles. | PROFILE_SIZE_X | $(P)$(R)ProfileSizeX_RBV | longin |
|
NDPluginStats ProfileSizeY |
asynInt32 | r/w | Number of array elements in the Y profiles. | PROFILE_SIZE_Y | $(P)$(R)ProfileSizeY_RBV | longin |
|
NDPluginStats CursorX |
asynInt32 | r/w | X position of a user-defined cursor for profiles. | CURSOR_X |
$(P)$(R)CursorX $(P)$(R)CursorX_RBV |
longout longin |
|
NDPluginStats CursorY |
asynInt32 | r/w | Y position of a user-defined cursor for profiles. | CURSOR_Y |
$(P)$(R)CursorY $(P)$(R)CursorY_RBV |
longout longin |
|
NDPluginStats ProfileAverageX |
asynFloat64Array | r/o | Profile of the average row in the array, i.e. the sum of all rows in the array divided by the number of rows. | PROFILE_AVERAGE_X | $(P)$(R)ProfileAverageX_RBV | waveform |
|
NDPluginStats ProfileAverageY |
asynFloat64Array | r/o | Profile of the average column in the array, i.e. the sum of all columns in the array divided by the number of columns. | PROFILE_AVERAGE_Y | $(P)$(R)ProfileAverageY_RBV | waveform |
|
NDPluginStats ProfileThresholdX |
asynFloat64Array | r/o | Same as ProfileAverageX except that all array elements less than CentroidThreshold are set to zero when computing the average. | PROFILE_THRESHOLD_X | $(P)$(R)ProfileThresholdX_RBV | waveform |
|
NDPluginStats ProfileThresholdY |
asynFloat64Array | r/o | Same as ProfileAverageY except that all array elements less than CentroidThreshold are set to zero when computing the average. | PROFILE_THRESHOLD_Y | $(P)$(R)ProfileThresholdY_RBV | waveform |
|
NDPluginStats ProfileCentroidX |
asynFloat64Array | r/o | X profile through the array in the row defined by CentroidY. | PROFILE_CENTROID_X | $(P)$(R)ProfileCentroidX_RBV | waveform |
|
NDPluginStats ProfileCentroidY |
asynFloat64Array | r/o | Y profile through the array in the column defined by CentroidX. | PROFILE_CENTROID_Y | $(P)$(R)ProfileCentroidY_RBV | waveform |
|
NDPluginStats ProfileCursorX |
asynFloat64Array | r/o | X profile through the array in the row defined by CursorY. | PROFILE_CURSOR_X | $(P)$(R)ProfileCursorX_RBV | waveform |
|
NDPluginStats ProfileCursorY |
asynFloat64Array | r/o | Y profile through the array in the row defined by CursorX. | PROFILE_CURSOR_Y | $(P)$(R)ProfileCursorY_RBV | waveform |
| Array histogram | ||||||
|
NDPluginStats ComputeHistogram |
asynInt32 | r/w | Flag to control whether to compute the histogram for this array (0=No, 1=Yes). Not computing the histogram reduces CPU load. | COMPUTE_HISTOGRAM |
$(P)$(R)ComputeHistogram $(P)$(R)ComputeHistogram_RBV |
bo bi |
|
NDPluginStats HistSize |
asynInt32 | r/w | Number of elements (bins) in the histogram | HIST_SIZE |
$(P)$(R)HistSize $(P)$(R)HistSize_RBV |
longout longin |
|
NDPluginStats HistMin |
asynFloat64 | r/w | Minimum value for the histogram. All values less than or equal to this will be in the first bin of the histogram. | HIST_MIN |
$(P)$(R)HistMin $(P)$(R)HistMin_RBV |
ao ai |
|
NDPluginStats HistMax |
asynFloat64 | r/w | Maximum value for the histogram. All values greater than or equal to this will be in the last bin of the histogram. | HIST_MAX |
$(P)$(R)HistMax $(P)$(R)HistMax_RBV |
ao ai |
|
NDPluginStats HistEntropy |
asynFloat64 | r/o | Entropy of the image. This is a measure of the sharpness of the histogram, and is often a useful figure of merit for determining sharpness of focus, etc. It is defined as -SUM(BIN[i]*log(BIN[i]), where the sum is over the number of bins in the histogram and BIN[i] is the number of elements in bin i. | HIST_ENTROPY | $(P)$(R)HistEntropy_RBV | ai |
|
NDPluginStats HistArray |
asynFloat64Array | r/o | Histogram array, i.e. counts in each histogram bin. | HIST_ARRAY | $(P)$(R)Histogram_RBV | waveform |
If the values of CentroidThreshold, CursorX, or CursorY are changed then the centroid and profile calculations are performed again immediately on the last array collected. Thus updated centroid statistics and profiles can be displayed even when new arrays are not being acquired. These calculations are only performed when enabled by ComputeCentroid and ComputeProfiles.
The NDPluginStats plugin is created with the NDStatsConfigure command, either from C/C++ or from the EPICS IOC shell.
NDStatsConfigure(const char *portName, int queueSize, int blockingCallbacks,
               const char *NDArrayPort, int NDArrayAddr,
               int maxBuffers, size_t maxMemory,
               int priority, int stackSize)
For details on the meaning of the parameters to this function refer to the detailed documentation on the NDStatsConfigure function in the NDPluginStats.cpp documentation and in the documentation for the constructor for the NDPluginStats class.
The following MEDM screen provides access to the parameters in NDPluginDriver.h and NDPluginStats.h through records in NDPluginBase.template and NDStats.template.
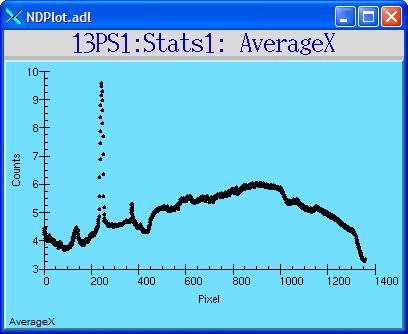
The following MEDM screen shows the average profile of an image in the X direction.
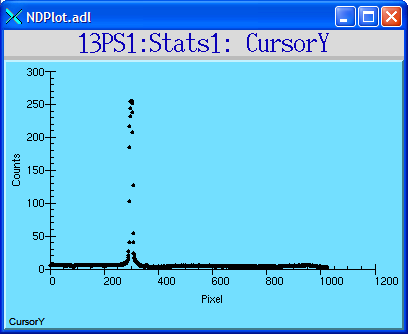
The following MEDM screen shows the profile of an image in the Y direction at the location of the user-defined cursor.
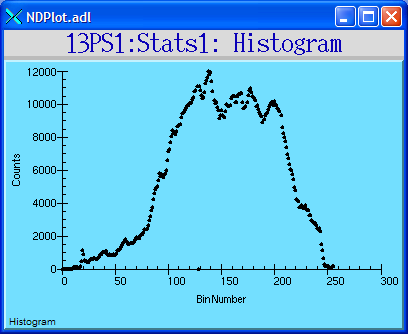
The following MEDM screen shows the histogram of intensities of an array.
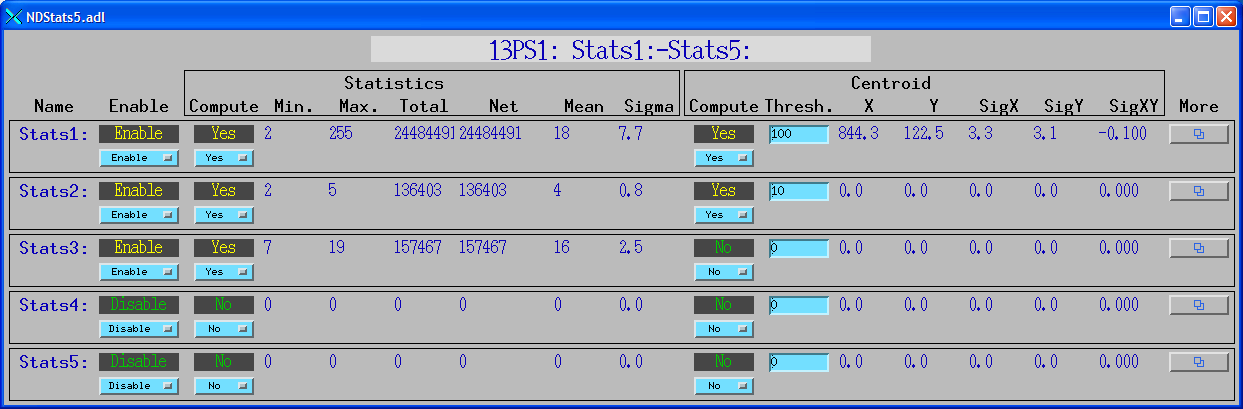
The following MEDM screen combines many parameters for 5 NDPluginStats plugins on a single screen.
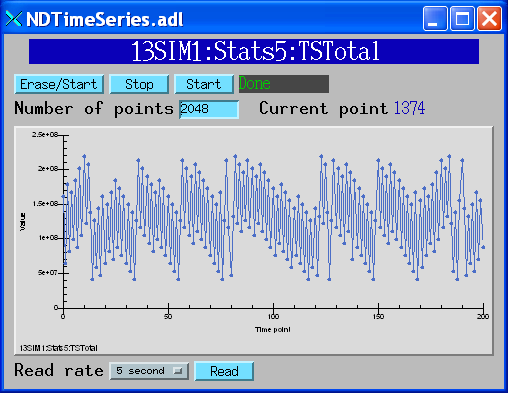
The following MEDM screen shows the the total counts from the Stats5 plugin. This is the total counts as a function of time.
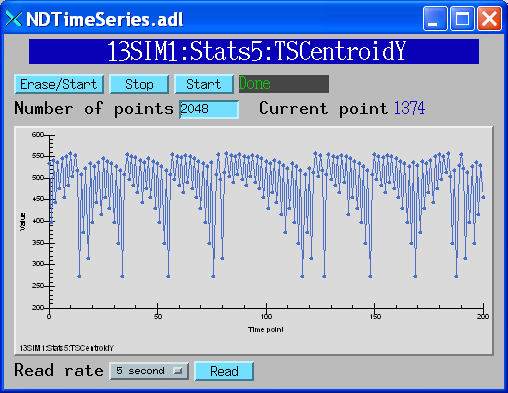
The following MEDM screen shows the Y centroid as a function of time from the Stats5 plugin.
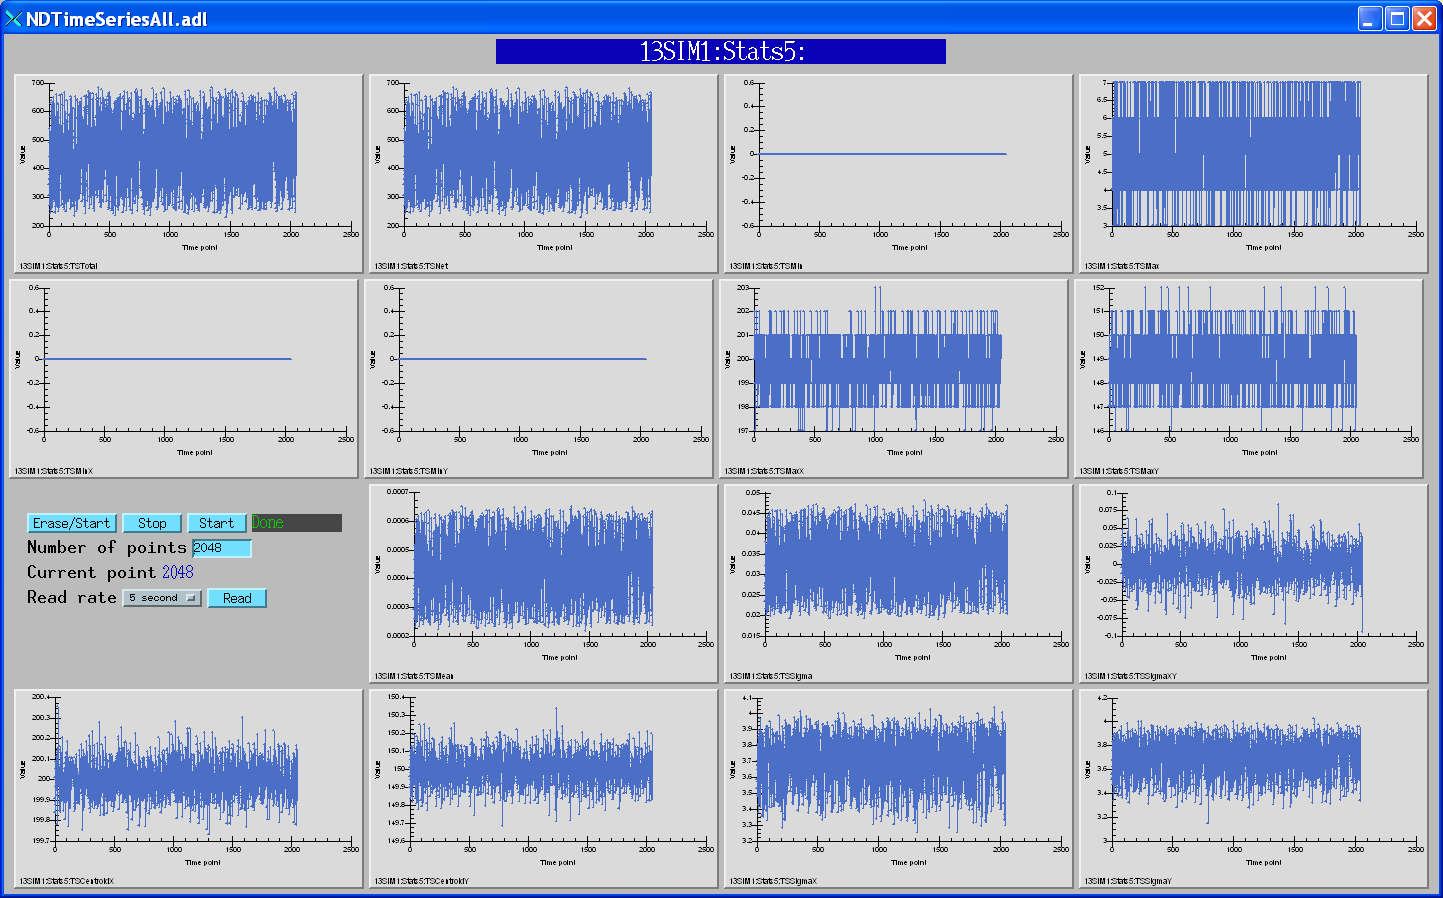
The following MEDM screen shows all statistics as a function of time from the Stats5 plugin.